


Exploratory Data Analysis Report
2019-08-19
Exploratory Data analysis (EDA)
Analyzing the data sets to summarize their main characteristics of variables, often with visual graphs, without using a statistical model.
1. Overview of the data
Understanding the dimensions of the dataset, variable names, overall missing summary and data types of each variables
# Overiview of the data
ExpData(data=data,type=1)
# Structure of the data
ExpData(data=data,type=2)2. Summary of numerical variables
Summary of all numeric variables
ExpNumStat(data,by="A",gp=NULL,Qnt=seq(0,1,0.1),MesofShape=2,Outlier=TRUE,round=2)3. Distributions of numerical variables
Graphical representation of all numeric features
- Quantile-quantile plot(Univariate)
ExpOutQQ(data,nlim=4,fname=NULL,Page=c(2,2),sample=sn)## $`0`
- Density plot (Univariate)
ExpNumViz(data,target=NULL,type=1,nlim=NULL,fname=NULL,col=NULL,Page=c(2,2),theme=theme,sample=sn)## $`0`
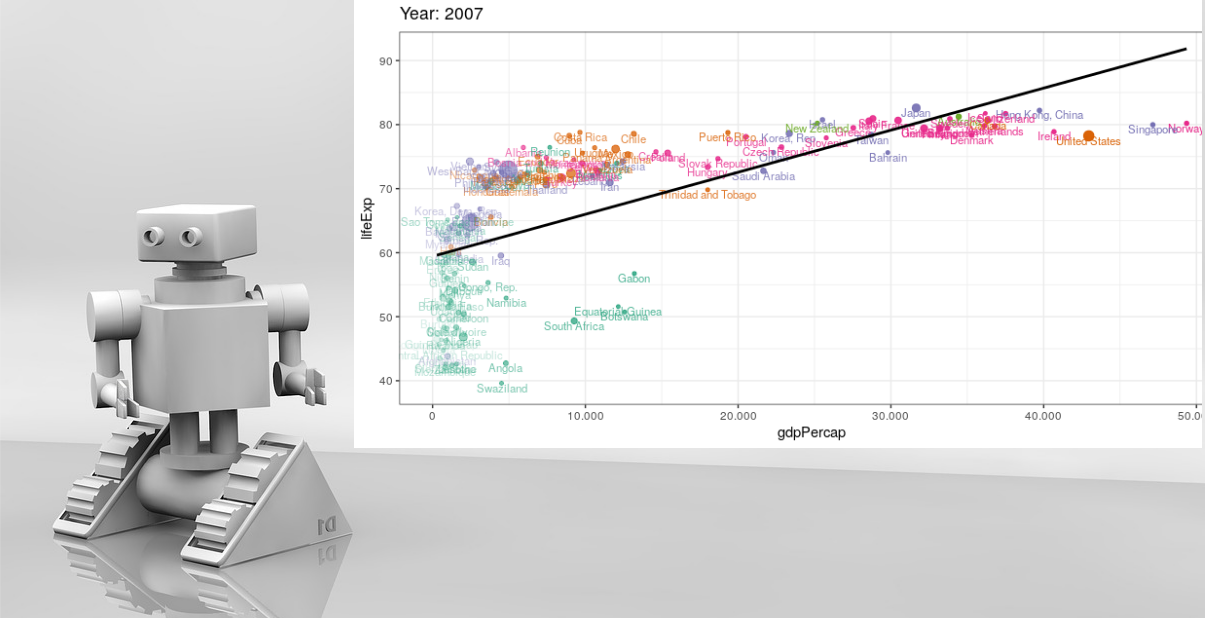
- Scatter plot (Bivariate)
ExpNumViz(data,Page=c(2,1),sample=sn,theme=theme,scatter=TRUE)## $`0`
4. Summary of categorical variables
Summary of categorical variables
- frequency for all categorical independent variables
ExpCTable(data,Target=NULL,margin=1,clim=10,nlim=NULL,round=2,bin=NULL,per=T)
NAis Not Applicable
5. Distributions of categorical variables
- Bar plots for all categorical variables
Bar plots for all categorical variables
Bar plot with vertical or horizontal bars for all categorical variables
ExpCatViz(data,target=NULL,fname=NULL,clim=10,margin=2,theme=theme,Page = c(2,2),sample=sc)## $`0`


Share this post
Twitter
LinkedIn
Email